October 14, 2014

On a windy day on Lake George, when the surface is whipped into white-caps, you might wonder: where is all that water going? The answer, in astonishing detail, is within our grasp as a network of sensors is deployed throughout the watershed as part of the Jefferson Project at Lake George, a partnership between Rensselaer Polytechnic Institute, IBM, and The FUND for Lake George.
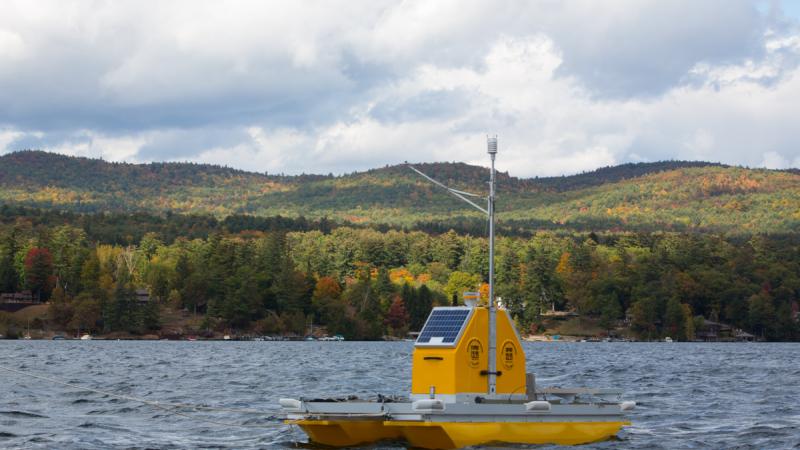
The sensors, including two "vertical profilers" like the one pictured above (deployed on just such a windy day last week), will gather data to fuel three complex computer models – a weather model, a runoff and circulation model, and ultimately, a food web model – that will give scientists an unprecedented understanding of the Lake George watershed and how stressors such as contaminants, invasive species, and development affect its pristine ecosystem.
Rick Relyea, professor, David M. Darrin '40 Endowed Chair, and scientific lead of the Jefferson Project described it this way:
The overarching question is - how does Lake George function and what, if any, are the impacts of human activity? There are three aspects to this project that will answer that question: first, we monitor what the lake is doing, how the lake is changing over time; second, we conduct a series of experiments that will give us a clear link between cause and effect; third, we create sophisticated models of the lake that will show how the lake functioned before human impact, how it functions now, and how it might function under various scenarios.
The shorthand is that the Jefferson Project is turning Lake George into the world's "smartest lake."
Since launching in June, 2013, Jefferson Project partners have completed a high-resolution bathymetric and topographic survey of the lake, used existing data to develop the first circulation and runoff models of the lake, and built a new data visualization laboratory at Rensselaer's Margaret A. and David M. Darrin '40 Fresh Water Institute (more on that later).
Data from the sensors – which will be deployed between now and the end of 2015 – will be used to enhance the early computer models. Researchers currently envision a complement of five vertical profilers, 12 stream monitors on the largest tributaries flowing into the lake, eight current profilers, and 11 weather stations.
The two vertical profilers deployed last week are self-contained mini laboratories. Mounted on a floating platform are solar panels to collect energy, batteries to store it, a winch to raise and lower sampling equipment, computers to govern use of the winch and gather data, a GPS to monitor position, and a cell phone to relay the data to the Darrin Fresh Water Institute (DFWI).
The computer that controls the profiler was custom-built to aggressively manage available power, said Eli M. Dow, an IBM researcher developing cyber-infrastructure for the project. The software not only takes into account how much power is available from the on-board batteries and solar panels, it also uses IBM's Deep Thunder weather forecasting to predict probable future energy, ensuring that work doesn't come to a halt during a spate of cloudy weather. As Dow put it:
It's not remote operation, it's really a semi-autonomous lab. We give it instructions on what we want, and it does the data collection and transmission in an intelligent way. Moving the winch is the most power hungry operation, and we have to be smart about how many times we lower it down and raise it up.
For example, water within the lake is divided by thermoclines – thin layers of water in which temperature changes rapidly with depth. Researchers may want more information from the juncture between the layers, but the thermocline itself shifts in depth. The software allows the profiler to conduct an initial run to identify the thermocline, and then to return to that depth to collect more data.
The sensors on the winch can detect temperature, acidity, dissolved oxygen, total algae, dissolved organic matter, and chloride; making it possible for researchers to gauge water quality, and also track the movement of water in the lake.
At the data visualization laboratory, which will officially open during a ribbon-cutting ceremony on Friday, October 17, researchers will be able to view models constructed with the data in a resolution as fine as half a meter. The results, said Relyea, will be a game-changer for environmental monitoring, prediction, and remediation of critical natural systems:
This is an unprecedented effort by three partners to understand the most minute details within a body of water. What we're doing is at Lake George, but it has global implications.