March 1, 2019

The tuberculosis bacteria—Mycobacterium tuberculosis—infects more than 2 billion people each
year. Some will develop full-blown tuberculosis, while others, although
infected, never develop symptoms of the disease. The population is divided
among people who are resistant, susceptible, and super susceptible, and no one
is exactly sure why.
With a grant from the National Institutes of Health (NIH), a
team including Rensselaer Polytechnic Institute researcher Bulent Yener will
search for markers—genetic, phenotypic, and pathological—that distinguish the
three groups. Yener, a professor of computer science and director of the Data
Science Research Center, joins lead researchers at Tufts University, and
researchers at Wake Forest University, in the five-year $3.3 million project,
supported by an R01 award from the National Heart, Lung, and Blood Institute of
the NIH.
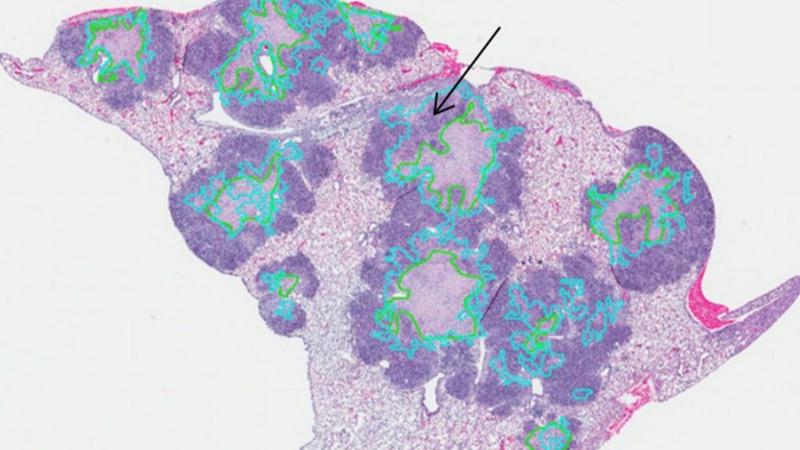
Yener developed “cell graphs,” a computational method that
combines image processing with graph theory to reveal the function of cells in
tissue based on microstructural images of the tissue. Where a pathologist
looking at a tissue sample may be able to detect five to 10 patterns, the
computer finds more than 100 features invisible to the human eye, allowing it
to more quickly and accurately classify the function of tissue using the cell
graph method.
Yener explained this method in a Communication of the
Association of Computing Machinery video that can be found here.
In the tuberculosis research, the team will study Diversity
Outbred mice, a population with abundant genetic diversity and variety similar
to the human population, as a model for the possible outcomes of infection with
Mycobacterium tuberculosis. After
grouping results into the three categories of resistant, susceptible, and super
susceptible, the team will search for markers and produce predictive models
based on the markers they identify.
Preliminary research, funded with an earlier NIH R 21 grant,
identified some promising markers among super-susceptible mice, including a
10-protein lung biomarker signature, and a pattern of cell granulomas with
neutrophils and necrosis. They also found that weight loss is correlated with severity
of the reaction.
Yener will analyze tissue images using the cell graphs
technique he developed. Yener will also use the images and other data gathered
from experiments to establish which features are most relevant to
classification, producing signatures that he will use to build and validate
predictive models.